< >

Regions of France: Monthly Milk Deliveries

+ Add to Favorites
On this page, you will find:
  • a table listing the monthly deliveries of cow's milk in the Regions of France;
  • a table listing the monthly deliveries of cow's organic milk in the Departments of France;
  • a table listing the monthly deliveries of cow's organic milk in the Regions of France;
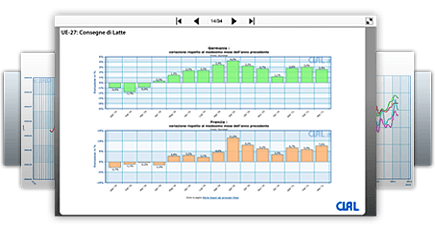
  • a chart showing the monthly figures of total and organic milk deliveries in France;
  • a chart showing the milk deliveries with breakdown by Regions of France.
Regions of France deliveries can be viewed from 2014 and changes in France's milk deliveries

Farm-gate milk prices in France » Organic milk prices in France »

2023
Milk deliveries in 2024 with breakdown by Regions of France (million liters)
Regions Jan Feb Mar Apr May Jun Jul Aug Sep Oct Nov Dec Total 2024 ± on 2023 *
Auvergne-Rhone-Alpes 198 193 210                   601,17 -1,9%
Bourgogne-Franche-Comte 143 138 149                   430,29 +2,9%
Bretagne 442 428 466                   1.335,57 +1,7%
Centre-Val De Loire 35 35 37                   106,96 +2,0%
Grand Est 206 199 216                   621,01 +5,5%
Hauts-De-France 194 186 200                   580,13 +1,7%
Ile De France 2,8 2,7 2,9                   8,36 +2,3%
Normandie 327 315 341                   982,24 +0,8%
Nouvelle-Aquitaine 74 72 79                   224,57 +0,1%
Occitanie 50 49 53                   151,66 -4,0%
Pays-De-La-Loire 317 307 331                   954,76 +3,0%
Provence-Alpes-Cote D'azur 1,5 1,5 1,5                   4,49 -2,9%
France Jan Feb Mar Apr May Jun Jul Aug Sep Oct Nov Dec Total 2024
Total France 2024 1.990 1.926 2.085 - - - - - - - - - 6.001
% Change on 2023 -0,2% +4,1% +1,1% - - - - - - - - - +1,6%
Total France 2023 1.994 1.849 2.062 2.043 2.076 1.885 1.859 1.791 1.695 1.804 1.756 1.914 22.728
Organic Milk deliveries in 2024 with breakdown by France Departments (million liters)
Departments Jan Feb Mar Apr May Jun Jul Aug Sep Oct Nov Dec Total 2024 ± on 2023 *
Auvergne-Limousin 5,07 4,93 5,31                   15,31 -14,3%
Centre 0,90 0,97 1,07                   2,93 +10,0%
Charente-Poitou 4,49 4,55 5,08                   14,12 -2,3%
Grand Est 18,24 17,92 18,99                   55,15 -2,9%
Grand Ouest 40,34 39,59 46,46                   126,39 -1,1%
Nord-Picardie 4,92 4,88 5,37                   15,17 -8,2%
Normandie 10,98 10,52 12,10                   33,60 +1,5%
Sud-Est 7,88 7,75 8,39                   24,01 -12,1%
Sud-Ouest 4,61 4,53 5,05                   14,19 -9,5%
Organic Milk deliveries in 2024 with breakdown by France Regions (million liters)
Regions Jan Feb Mar Apr May Jun Jul Aug Sep Oct Nov Dec Total 2024 ± on 2023 *
Auvergne-Rhone-Alpes 12,29 12,07 13,04                   37,40 -12,7%
Bourgogne-Franche-Comte 8,58 8,28 8,86                   25,71 -2,3%
Bretagne 20,04 19,37 24,20                   63,60 +0,1%
Centre-Val De Loire 0,80 0,87 0,96                   2,63 +12,5%
Grand Est 10,91 10,84 11,39                   33,14 -6,0%
Hauts-De-France 3,92 3,93 4,37                   12,22 -3,3%
Normandie 10,98 10,52 12,10                   33,60 +1,5%
Nouvelle-Aquitaine 2,53 2,54 2,88                   7,94 -9,8%
Occitanie 4,10 3,99 4,47                   12,56 -8,6%
Pays-De-La-Loire 23,03 23,01 25,33                   71,37 -2,0%
France Jan Feb Mar Apr May Jun Jul Aug Sep Oct Nov Dec Total 2024
Total Organic milk 2024 97 96 108 - - - - - - - - - 301
% Change on 2023 -5,5% -1,7% -3,6% - - - - - - - - - -3,6%
Total Organic milk 2023 103 97 112 120 124 107 100 96 90 97 91 97 1.234
Last update: 15-05-2024
* % change from same period of previous year.
Source: FranceAgriMer

Rolling year: for each month the chart visualizes the production in that month plus the production of the previous 11 months. With this method is always considered the total production in a time window of 12 months, so it is possible to identify the trend without the effect of seasonality.