


.jpg)


.jpg)


Argentina: dairy sector
This page contains data regarding key components of the Argentinian dairy industry over a given time period.
The following report:
- highlights the complexity of the industry, which should be considered from several viewpoints: the commodities area, the variety of dairy derivatives, transit trade and domestic consumption;
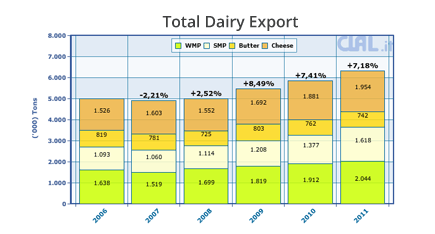
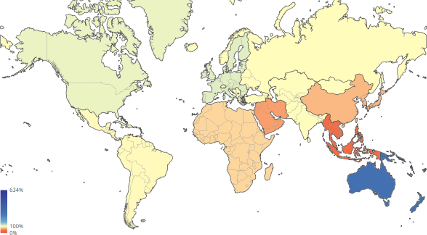
- indicates how the export-import ratio is completely in favour of exports - of WMP in particular;
- stresses the particular features of a traditional product that is prevalent in domestic consumption: the dulce de leche.
| ARGENTINA: DAIRY SECTOR | ||||||||||
| x 1.000 ton | ||||||||||
| RAW MATERIAL AREA | 2020 | 2021 | 2022 | 2023 | 2023 | 2024 | % | Period | ||
| Number of dairy cows ('000) (Source: FAO) | 1.547 | 1.527 | 1.563 | |||||||
| Number of dairy cows ('000) (Source: Senasa) | 1.587 | 1.562 | ||||||||
| Milk production (Mil Lt) | 11.113 | 11.553 | 11.557 | 11.326 | 2.583 | 2.224 | -13,9% | Jan-Mar 2024 | ||
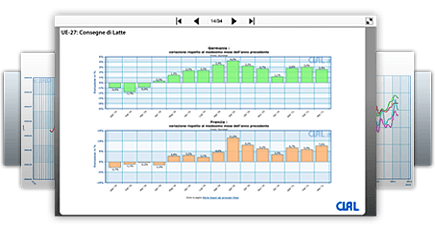
| Milk delivery (Mil Lt) | 10.329 | 10.739 | 10.743 | 10.528 | 2.416 | 2.081 | -13,9% | Jan-Mar 2024 | ||
| % Delivery on production | 93,0% | 93,0% | 93,0% | 93,6% | ||||||
| Farm gate milk price (€ x 100 lt) | 23,51 | 26,72 | 36,14 | 35,63 | 36,77 | 33,45 | -9,0% | Jan-Apr 2024 | ||
| ± % Over the same period of the previous year | +13,7% | +35,2% | -1,4% | |||||||
| Corn price (Rosario) (€\Ton) | 131,4 | 170,0 | 232,8 | 211,3 | 225,0 | 166,2 (p) | -26,1% | Jan-May 2024 | ||
| Soybeans price (Rosario) (€\Ton) | 225,6 | 286,5 | 406,0 | 409,9 | 416,2 | 280,4 (p) | -32,6% | Jan-May 2024 | ||
| DAIRY PRODUCTION | 2020 | 2021 | 2022 | 2023 | 2023 | 2024 | % | Period | ||
| Liquid milk (Mil Lt) | 1.254 | 1.199 | 1.168 | 1.152 | 276 | 225 | -18,7% | Jan-Mar 2024 | ||
Butter

|
35 | 41 | 39 | 34 | 7,4 | 6,0 | -18,7% | Jan-Mar 2024 | ||
|
Cheese
|
421 | 460 | 460 | 471 | 107 | 104 | -3,5% | Jan-Mar 2024 | ||
|
Hard cheese
|
33 | 37 | 38 | 42 | 9,6 | 9,8 | +1,7% | Jan-Mar 2024 | ||
|
Semi-hard cheese
|
126 | 151 | 156 | 161 | 36 | 36 | +0,6% | Jan-Mar 2024 | ||
|
Soft cheese
|
174 | 181 | 176 | 179 | 41 | 41 | -0,9% | Jan-Mar 2024 | ||
|
Processed cheese
|
59 | 58 | 57 | 59 | 13 | 9,7 | -27,0% | Jan-Mar 2024 | ||
| Other cheeses (grated, powdered, melted, etc.) | 28 | 32 | 33 | 30 | 8,0 | 7,7 | -2,7% | Jan-Mar 2024 | ||
|
WMP (Whole milk powder)
|
213 | 234 | 213 | 180 | 35 | 30 | -13,0% | Jan-Mar 2024 | ||
|
SMP (Skimmed milk powder)
|
52 | 55 | 51 | 31 | 7,9 | 7,6 | -3,9% | Jan-Mar 2024 | ||
| Cream | 61 | 61 | 66 | 63 | 14 | 13 | -5,0% | Jan-Mar 2024 | ||
| Dulce de leche | 107 | 97 | 102 | 104 | 22 | 21 | -5,6% | Jan-Mar 2024 | ||
| Milk chocolate (Mil Lt) | 23 | 40 | 46 | 34 | 10 | 8,6 | -15,5% | Jan-Mar 2024 | ||
| Dairy desserts and custards | 27 | 27 | 27 | 24 | 6,2 | 1,6 | -73,5% | Jan-Mar 2024 | ||
| Yogurt | 356 | 332 | 352 | 345 | 113 | 82 | -27,8% | Jan-Mar 2024 | ||
| EXPORT | 2020 | 2021 | 2022 | 2023 | 2023 | 2024 | % | Period | ||
| Whey powder (HS 0404) | TOP importers | 32 | 40 | 38 | 40 | 9,7 | 9,5 | -2,4% | Jan-Mar 2024 | |
| Butter (HS 0405) | TOP importers | 14 | 16 | 12 | 5,6 | 2,6 | 1,7 | -35,4% | Jan-Mar 2024 | |
| Cheese (HS 0406) | TOP importers | 44 | 52 | 57 | 64 | 15 | 18 | +17,7% | Jan-Mar 2024 | |
| SMP (skimmed milk powder - HS 040210) | TOP importers | 14 | 11 | 16 | 17 | 5,0 | 5,7 | +13,8% | Jan-Mar 2024 | |
| WMP (whole milk powder - HS 040221+040229) | TOP importers | 126 | 128 | 133 | 96 | 25 | 36 | +41,8% | Jan-Mar 2024 | |
| Casein (HS 350110) | TOP importers | |||||||||
| Infant milk formula (HS 190110) | TOP importers | 0,4 | 0,2 | 0,1 | 0,3 | 0,0 | 0,1 | 0,0% | Jan-Mar 2024 | |
| IMPORT | 2020 | 2021 | 2022 | 2023 | 2023 | 2024 | % | Period | ||
| Condensed milk (HS 040291+040299) | TOP exporters | 0,2 | 0,4 | 0,4 | 0,1 | 0,0 | 0,0 | -0,2% | Jan-Mar 2024 | |
| Whey powder (HS 0404) | TOP exporters | 0,8 | 1,1 | 1,0 | 1,1 | 0,3 | 0,4 | +30,8% | Jan-Mar 2024 | |
| Cheese (HS 0406) | TOP exporters | 1,1 | 2,8 | 4,6 | 2,9 | 1,1 | 0,5 | -53,0% | Jan-Mar 2024 | |
| Infant milk formula (HS 190110) | TOP exporters | 1,6 | 2,0 | 1,8 | 0,8 | 0,2 | 0,1 | -66,1% | Jan-Mar 2024 | |
| STOCK (at 31 December) | 2020 | 2021 | 2022 | 2023 | 2023 | 2024 | % | Period | ||
| Liquid milk (Mil Lt) | 40,9 | 51,7 | 41,0 | 37,1 | 31,8 | 25,6 | -19,5% | Mar 2024 | ||
|
Butter
|
4,6 | 4,1 | 5,2 | 4,1 | 2,8 | 2,5 | -7,8% | Mar 2024 | ||
|
Cheese
|
47,8 | 49,7 | 49,9 | 55,3 | 44,6 | 52,6 | +17,9% | Mar 2024 | ||
|
Hard cheese
|
13,6 | 14,2 | 15,5 | 18,5 | 15,4 | 19,1 | +24,1% | Mar 2024 | ||
|
Semi-hard cheese
|
15,2 | 18,3 | 18,0 | 20,2 | 15,1 | 17,3 | +14,6% | Mar 2024 | ||
|
Soft cheese
|
15,0 | 11,8 | 12,7 | 12,5 | 10,4 | 11,7 | +12,1% | Mar 2024 | ||
|
Processed cheese
|
1,6 | 3,0 | 1,5 | 2,1 | 1,6 | 1,5 | -6,2% | Mar 2024 | ||
| Other cheeses (grated, powdered, melted, etc.) | 2,3 | 2,4 | 2,1 | 2,0 | 2,1 | 3,0 | +43,4% | Mar 2024 | ||
|
WMP (Whole milk powder)
|
22,3 | 32,6 | 29,7 | 31,5 | 20,6 | 16,7 | -18,8% | Mar 2024 | ||
|
SMP (Skimmed milk powder)
|
5,8 | 7,2 | 8,7 | 5,9 | 6,7 | 4,8 | -28,2% | Mar 2024 | ||
| Cream | 1,5 | 2,0 | 2,4 | 1,5 | 1,8 | 1,6 | -14,3% | Mar 2024 | ||
| Dulce de leche | 5,5 | 5,7 | 5,9 | 5,3 | 5,0 | 4,8 | -4,4% | Mar 2024 | ||
| Milk chocolate (Mil Lt) | 2,4 | 5,5 | 8,4 | 3,8 | 4,0 | 4,4 | +11,9% | Mar 2024 | ||
| Dairy desserts and custards | 0,5 | 1,4 | 0,6 | 1,9 | 0,6 | 0,4 | -28,3% | Mar 2024 | ||
| Yogurt | 7,0 | 6,7 | 8,6 | 13,3 | 8,9 | 8,6 | -3,0% | Mar 2024 | ||
| DOMESTIC CONSUMPTION (Source: FAS-USDA) | 2020 | 2021 | 2022 | 2023 | 2023 | 2024(f) | % | Period | ||
| Cheese | 420 | 457 | 435 | 440 | 440 | 395 | -10,2% | Jan-Dec 2024 | Butter | 14 | 10 | 11 | 14 | 14 | 12 | -14,3% | Jan-Dec 2024 | SMP | 23 | 28 | 26 | 15 | 15 | 20 | +33,3% | Jan-Dec 2024 | WMP | 80 | 73 | 70 | 80 | 80 | 75 | -6,3% | Jan-Dec 2024 |
| PER CAPITA CONSUMPTIONS (kg) | 2020 | 2021 | 2022 | 2023 | 2023 | 2024(f) | % | Period | ||
| Cheese | 9,33 | 10,09 | 9,56 | 9,61 | ||||||
| Butter | 0,31 | 0,22 | 0,24 | 0,31 | ||||||
| SMP | 0,51 | 0,62 | 0,57 | 0,33 | ||||||
| WMP | 1,78 | 1,61 | 1,54 | 1,75 | ||||||
| % Self-sufficiency | 115,7% | 115,4% | 116,6% | 114,6% | ||||||
| SOCIO-ECONOMIC INDICATORS | 2020 | 2021 | 2022 | 2023 | 2023 | 2024(f) | % | Period | ||
| Population ('000) | 45.036 | 45.277 | 45.510 | 45.774 | ||||||
| GDP per capita (U.S. dollars) | 8.572 (e) | 10.632 (e) | 13.620 (e) | 13.297 (e) | ||||||
| GDP per capita (€) * | 7.500(e) | 8.989(e) | 12.934(e) | 12.298(e) | ||||||
(e) estimated
* Per capita GDP in Euro is calculated by using the yearly average exchange rate
(p): partial data
(f): forecast
NOTE:Per capita consumptions are obtained dividing total consumption (Source FAS-USDA ) by the population (Source FAO)
Source Raw milk area: Subsecretaría de Lechería - Ministerio de Agroindustria; Number of cows: FAO, National Animal Health and Agrifood Quality Service (SENASA);
Source Dairy production: Subsecretaría de Lechería - Ministerio de Agroindustria, from 2015 data is collected by a panel of dairies according to "Relevamiento Coyuntural de la Resolución 230/16" and historical information of the "Resolución 7/14".
Source Export and Import: IHS
Source Consumption: FAS-USDA
GDP per capita: International Monetary Found
Source Population: FAO
Note: Self-sufficiency rate = Milk deliveries/(Domestic use in milk equivalent ME)
Domestic use in milk equivalent (ME) = Milk deliveries + Import in ME - Export in ME
Last update: 2024-05-17